Lecture 14
R topics
diamonds dataset
data("diamonds")
lm(formula = price ~ ., data = diamonds)
summary(lm(price ~ ., data=diamonds))
# what variables might be collinear?
#forward
min.model <- lm(formula = price ~ 1, data = diamonds)
max.model <- lm(formula = price ~ ., data = diamonds)
summary(min.model)
fwd.model <- step(fwd.model, direction='forward', scope=formula(max.model))
plot(fwd.model$anova$AIC, type='l')
# backward
bwd.model <- step(max.model, direction='backward', scope=formula(max.model))
#stepwise
step.model <- step(min.model, direction='both', scope=formula(max.model))
Logistic regression
p <- seq(0,1,by=.01)
y <- log(p/(1-p))
plot(y,p)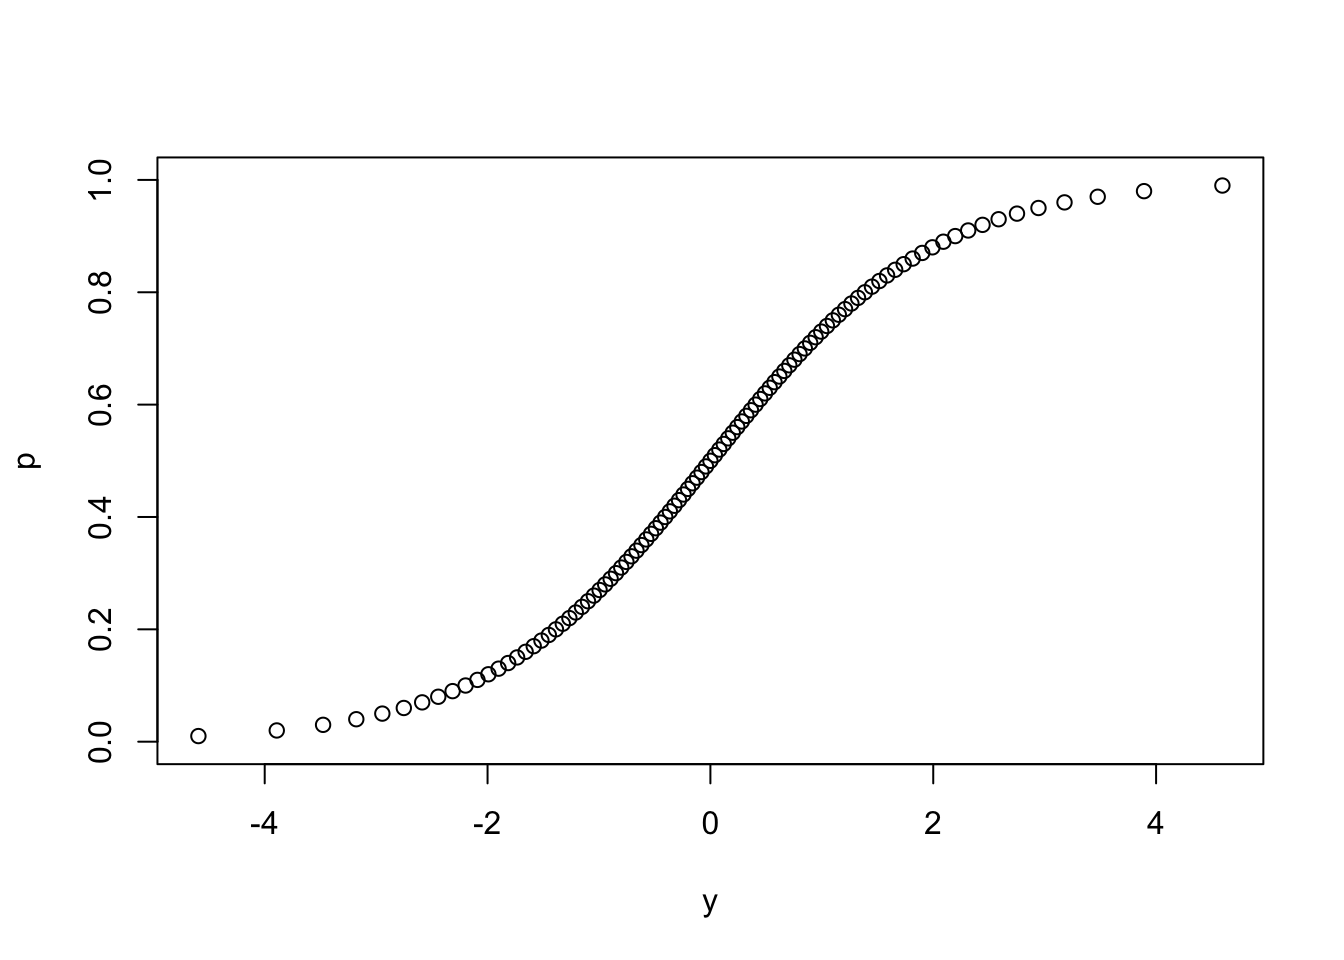
y <- qlogis(p) # same as log(p/(1-p))
yy <- seq(-4,4,by=.1)
pp <- exp(yy)/(1+exp(yy)) # same as plogis(yy)
plot(yy,pp)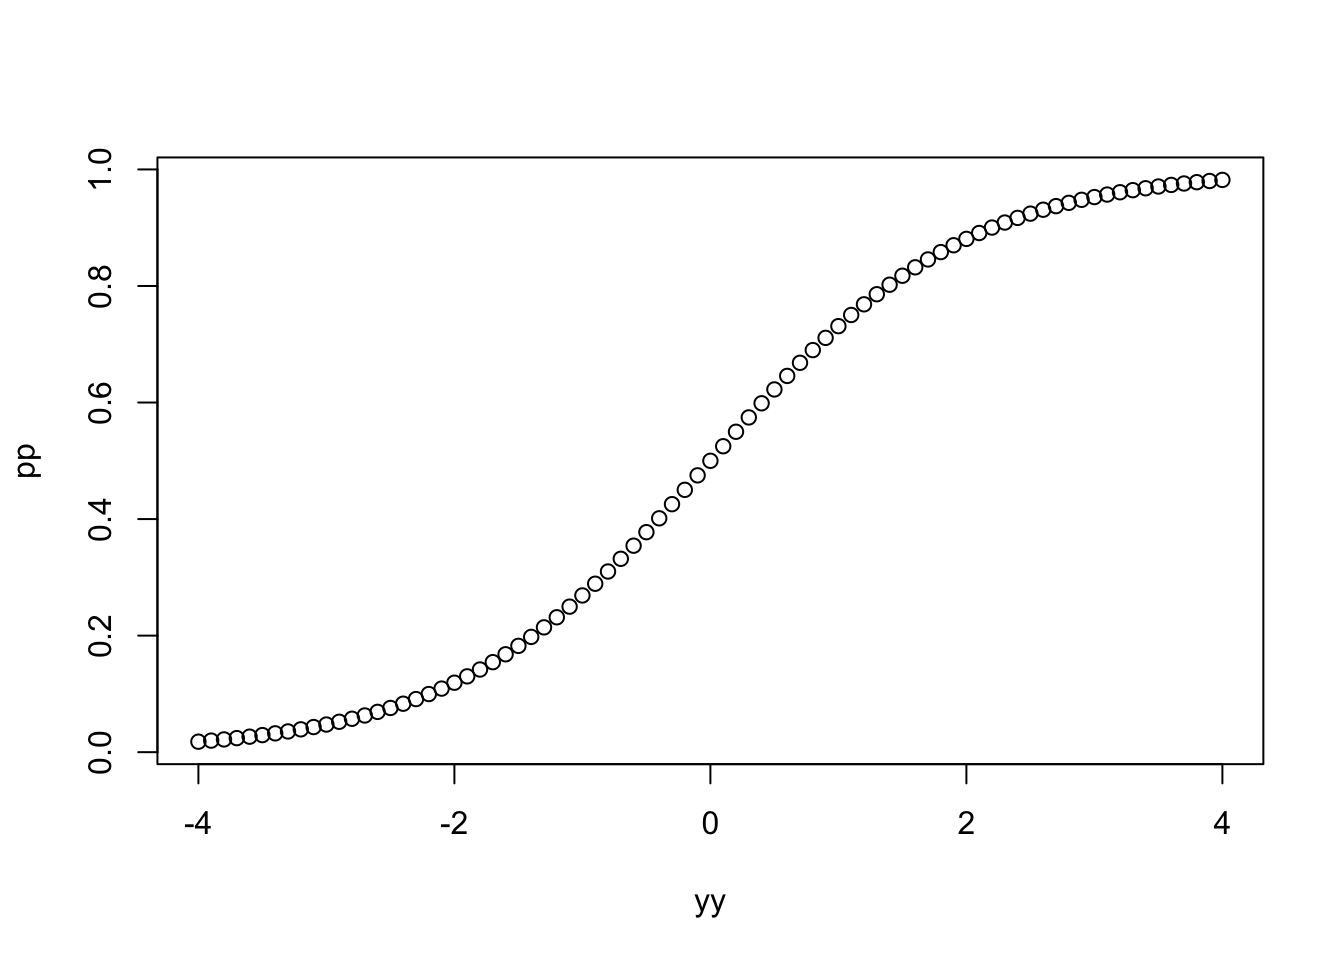
https://rdrr.io/cran/AER/man/ResumeNames.html
install.packages("AER")
library(AER)
data(ResumeNames)
summary(ResumeNames)
?ResumeNames
p <- length(which(ResumeNames$call=='yes'))/length(ResumeNames$call)
max.model <- glm(call ~ ., data=ResumeNames, family = "binomial")
exp(max.model$coefficients)/(1+exp(max.model$coefficients))
exp(confint.default(max.model))/(1+exp(confint.default(max.model)))

min.model <- glm(call~1, data=ResumeNames, family="binomial")
p <- length(which(ResumeNames$call=='yes'))/length(ResumeNames$call)
fit <- step(min.model, direction="both", scope=formula(max.model))

fit2 <- glm(call ~ experience + ethnicity, data=ResumeNames, family="binomial")
plot(predict(fit2)~ResumeNames$experience)
yhat <- predict(fit)
phat <- exp(yhat)/(1+exp(yhat))
ResumeNames$yhat <- yhat
ResumeNames$phat <- phat
confint.default(fit2)
ResumeNames$LL <- -2.7678643 + ResumeNames$experience * 0.0210596 - 0.6491508*as.integer(ResumeNames$ethnicity)
ResumeNames$UL <- -2.35320046 + ResumeNames$experience * 0.05711777 - 0.22766733*as.integer(ResumeNames$ethnicity)
ResumeNames$pLL <- plogis(ResumeNames$LL)
ResumeNames$pUL <- plogis(ResumeNames$UL)

library(ggplot2)
ggplot(ResumeNames, aes(x=experience, y=phat)) + geom_line(aes(color=ethnicity))
ggplot(ResumeNames, aes(x=experience, y=phat)) + geom_line(aes(color=ethnicity))  + geom_ribbon(aes(ymin=pLL, ymax=pUL,fill=ethnicity), alpha=.2)
for more info: https://stats.idre.ucla.edu/r/dae/logit-regression/ (Links to an external site.) more info about prediction intervals from OpenIntro book supplement: https://www.openintro.org/download.php?file=stat_extra_linear_regression_supp&referrer=/stat/textbook.php (Links to an external site.)
polynomial
data("diamonds")
quad.model <- lm(formula = price ~ .^2, data = diamonds)
summary(quad.model)
Review
Review: two-tailed tests need to be multiplied by 2 Review: statistical power visualization: https://www.researchgate.net/publication/310594053_A_Power_Calculator_for_the_Classical_Twin_Design/figures?lo=1 (Links to an external site.)
etc
In the news: a company called XTX. This was the matrix formulation of covariance/correlation, i.e. X transpose times X or t(X) %*% X in R. https://www.bloomberg.com/news/articles/2019-12-05/math-whiz-trades-without-humans-to-build-a-700-million-fortune (Links to an external site.) Regression could be a whole course in itself: https://www.amazon.com/Regression-Modeling-Strategies-Applications-Statistics/dp/3319194240/ref=sr_1_1?s=books&ie=UTF8&qid=1441550394&sr=1-1&keywords=regression+modeling+strategies&pebp=1441550411038&perid=1M513B6MCJBGAVEKA2YV (Links to an external site.) https://www.amazon.com/dp/0073014664/?coliid=I144NLRW11JXTK&colid=1V26VSQWS1U38&psc=1&ref_=lv_ov_lig_dp_it (Links to an external site.) for python/ML people: linear regression with tensor flow https://colab.research.google.com/drive/1RBKUXHBO8sq5GooArNrAKkoOkVlMSTKu (Links to an external site.)